
Views
Your data, your way.
76 data cells. 27 full-size panels. 10 templates. Build unlimited custom Views and switch between them mid-ride with a single click.
Templates
10 built-in templates
Start from a template and customize, or build your own from scratch.
Classic
The default Ride Cave layout
Race
W'bal and peak power for competition
Focus
Minimal view for structured workouts
Data
Maximum metrics density
Recovery
Heart rate and bio metrics for easy rides
Intervals
Interval tracking and trends
Endurance
Long ride efficiency and pacing
Stadium
Classic layout with a 3D track view
Entertainment
YouTube or Spotify with essential metrics
Route
GPS map with elevation and route metrics
Works everywhere
Desktop to phone, one View fits all.
Responsive layouts
Full multi-panel grids on desktop. Swipeable paginated cards on mobile and tablet. Your View adapts automatically, with no separate setup needed.
Share with the community
Make any View public. Browse, star, and clone community Views from the Discover tab. Found a layout you love? One click and it's yours.
Custom widgets
Create custom data too.
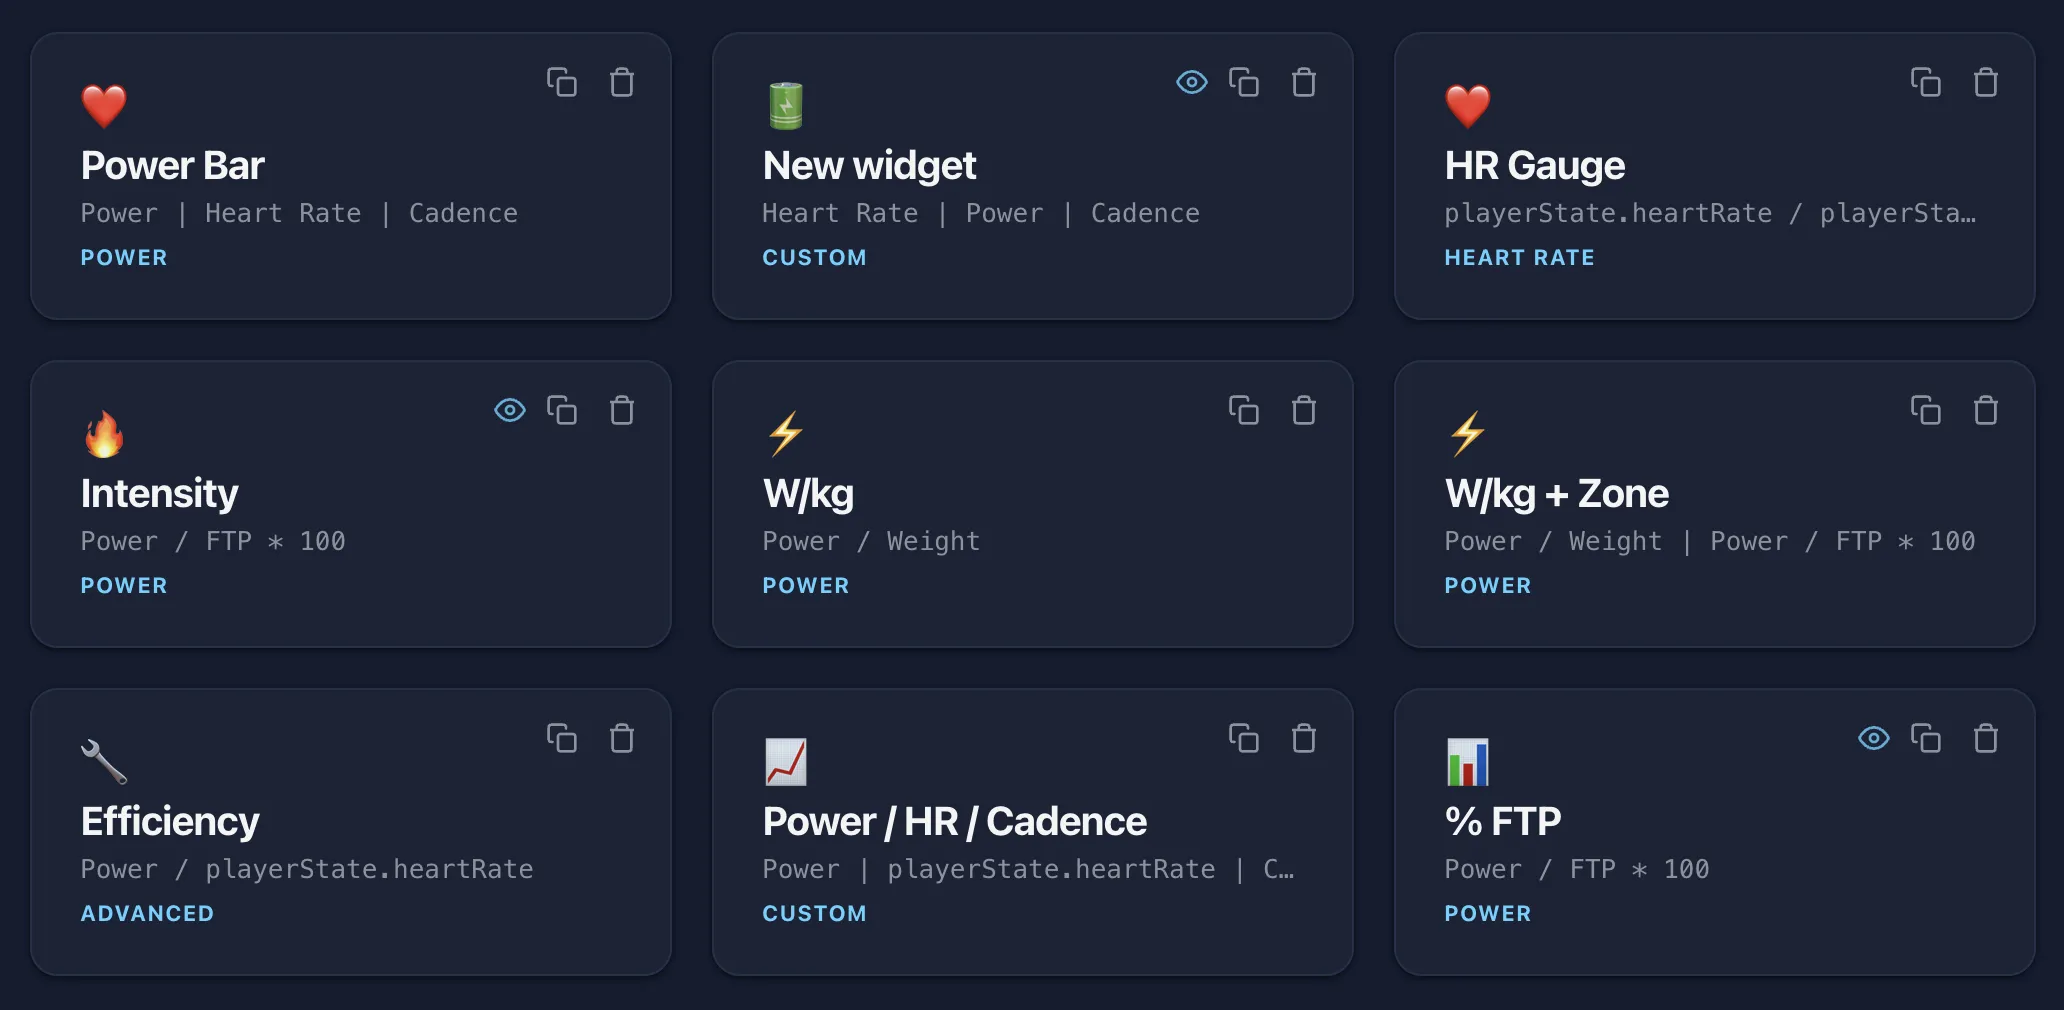
The widget formula engine lets you create your own data items from any combination of live fields, math functions, and operators. Build anything from W/kg to custom efficiency ratios, then drop it straight into your Views.
Data cells
All 76 data cells
Compact metrics that fit in a grid. Add up to six cells per panel for a dense data display.
| Heart Rate | |
|---|---|
Heart Rate | Live heart rate with session average and target indicator |
Average Heart Rate | Mean heart rate over the entire ride |
Maximum Heart Rate | Highest heart rate recorded during the ride |
Heart Rate Zone | Current heart rate training zone based on lactate threshold |
| Advanced | |
Power to Heart Rate Ratio | Efficiency metric comparing power output to heart rate |
Aerobic Decoupling | Drift between power and heart rate over the ride, available after 20 minutes. Heat, dehydration, and low fuel can raise it regardless of fitness. |
Current Gear | Virtual gear position and ratio |
| Cadence | |
Cadence | Live pedaling cadence with target zone indicator |
Average Cadence | Mean pedaling cadence over the entire ride |
Torque | Pedal torque estimated from power and cadence |
| Speed | |
Speed | Virtual speed based on power output |
Distance | Total virtual distance covered during the ride |
| Time | |
Time Elapsed | Total time since the ride started |
Time Remaining | Countdown of time left in the current workout |
Finish Time | Projected time of day the workout will end |
| Power | |
Average Power | Mean power output over the entire ride |
Normalized Power | Weighted average power that accounts for intensity variability |
Intensity Factor | Ratio of Normalized Power to FTP, indicating ride intensity |
Training Load | Overall training load combining duration and intensity |
Variability Index | Ratio of Normalized Power to average power, showing how steady your effort is |
Watts per Kilogram | Power output relative to body weight |
Normalized Power per Kilogram | Normalized Power relative to body weight |
Percent of FTP | Current power expressed as a percentage of your FTP |
Energy (kWh) | Real-time energy output in kilowatt-hours |
5-Second Peak Power | Highest 5-second average power achieved during the ride |
1-Minute Peak Power | Highest 1-minute average power achieved during the ride |
2-Minute Peak Power | Highest 2-minute average power achieved during the ride |
5-Minute Peak Power | Highest 5-minute average power achieved during the ride |
10-Minute Peak Power | Highest 10-minute average power achieved during the ride |
20-Minute Peak Power | Highest 20-minute average power achieved during the ride |
| W'bal | |
W'bal Percentage | Remaining W' (w-prime) anaerobic work capacity as a percentage |
W'bal Energy | Remaining W' (w-prime) anaerobic work capacity in kilojoules |
Time to Exhaustion | Estimated time until W' (w-prime) anaerobic reserves are depleted at current effort |
| Zones | |
Power Zone | Current power training zone based on your FTP |
| Strain | |
Total Strain | Combined training strain across all energy systems |
Low Strain | Aerobic strain from efforts below Critical Power |
High Strain | Glycolytic strain from efforts between Critical Power and Peak Power |
Peak Strain | Neuromuscular strain from efforts above Peak Power |
Strain Buckets | Visual breakdown of low, high, and peak strain as fill bars |
| Intervals | |
Interval Avg | Intensity bars showing avg power, HR, and cadence for the current interval |
vs Prev | Before/after comparison of current interval vs the previous one |
Interval Avg Power | Average power output for the current interval |
Current Interval | Zone, target, and what is left of the current interval (or rowing piece) |
Next Interval | Zone, target, and length of the upcoming interval (or rowing piece) |
| Breathing | |
Breath Rate | Live respiratory rate from a breathing sensor |
Minute Ventilation | Live minute ventilation (air volume per minute) |
Tidal Volume | Air volume per breath (L) |
I:E Ratio | Inhale-to-exhale time ratio |
Ventilation Quad | 2×2 grid of breath rate, ventilation, and rolling averages |
| Body Temp | |
Core Temperature | Live core body temperature from a CORE sensor |
Skin Temperature | Live skin temperature from a CORE sensor |
Heat Strain Index | Live heat strain index from a CORE sensor |
Temperature Quad | 2×2 grid of core temp, skin temp, HSI, and max core temp |
| Rowing | |
Split /500m | Current pace per 500m, tinted by deviation from the target split |
Rowing Power | Instantaneous watts, tinted by deviation from the target power |
Stroke Rate | Strokes per minute, tinted by deviation from the target rate |
SPI | Stroke Power Index: watts per stroke, the power-versus-rate link |
Average Split | Whole-session average pace per 500m |
Workout Left | Overall remaining across every piece, in meters and time |
Calories | Energy burned this session |
Strokes | Total strokes this session |
Drag Factor | The machine drag factor as reported by the erg |
| Track | |
Record Board | Session fastest lap / 200m / 500m |
Race Position | Your current position in the race |
Race Gap | Time gap to the rider ahead (or behind if leading) |
Laps Remaining | Laps left in the session |
| Route | |
Elevation | Current elevation based on eRoute position |
eRoute Position | Your position along the eRoute vs total distance |
Current Grade | Current road grade from the elevation profile |
Climbing Left | Remaining elevation gain to finish the eRoute |
Climbing Done | Elevation gain completed so far |
Companion Gap | Distance gap to your ride-along companion |
| Laps | |
Lap Number | Current lap number for loop routes |
Lap Time | Elapsed time in the current lap |
Best Lap | Fastest completed lap time |
Last Lap | Most recently completed lap time |
Panels
All 27 full-size panels
Charts, gauges, and visualizations that take up an entire panel slot.
| Charts | |
|---|---|
Live Power Chart | Scrolling power chart showing recent output with workout intervals |
Workout Overview Chart | Bird's-eye view of the entire workout with power trace |
Breathing Chart | Real-time breath rate and ventilation over time |
Temperature Chart | Real-time core and skin temperature over time |
VT Threshold | Plots breathing and heart rate data against power to help identify ventilatory thresholds during a ramp test. |
HRV Tachogram | Real-time RR interval plot showing beat-to-beat heart rate variability |
| Power | |
Power Meter | Live power reading with zone gauge and FTP adjustment controls |
| W'bal | |
W'bal Gauge | Semicircular gauge showing remaining W' (w-prime) anaerobic work capacity |
| Intervals | |
Interval Trends | Line chart showing power, HR, and cadence trends across intervals |
| Zones | |
Zone Time Distribution | Bar charts showing time spent in each power zone and HR zone |
7-Zone HR Time | Bar chart of time spent in each of the 7 HR zones (Friel model) |
| Rowing | |
Rowing Target | Hold split, power, and stroke rate in the target pocket |
Rowing Balance | Split, power, and rate targets with a live gauge for each |
| Track | |
Stadium View | 3D isometric velodrome showing your avatar on a virtual track |
Velodrome Arena | The live 3D / map velodrome with riders, with a map↔3D toggle |
Skill Panel | The skill mini-game UI — phase, criteria, timer and record |
Leaderboard + Laps | Race standings alongside the lap schedule |
| Media | |
YouTube | Watch YouTube videos or playlists during your workout |
Spotify | Listen to Spotify music, playlists, or podcasts during your workout |
| Route | |
eRoute Map | Live GPS map showing your position on the eRoute |
3D Fly-Through | Satellite 3D fly-through that follows your position on the eRoute |
Route World | One map with fly-through, overhead, and Street View modes |
Infinite World | Ride out into the Infinite World — a little hand-drawn world that shifts as you climb |
eRoute Map (lite) | The eRoute shape drawn from its own GPS trace - no map tiles |
Road Ahead | The gradient of the next 2 km, so you can see what is coming |
Conditions | The terrain, sky and weather of the world you are riding through |
Elevation Profile | Live elevation chart showing your progress through the eRoute |
Build your perfect View.
103 data items, flexible layouts, and unlimited saved Views. Start from a template or build from scratch.